New frequencies
EVLA receivers often are sensitive over a wider frequency range
than their VLA predecessors, and observations in these until now
unattainable frequencies have become possible.
Those interested in observing outside the traditional VLA bands
should be aware that only data from EVLA antennas can be used - VLA
antennas will not produce useful data at these frequencies. JObserve
does not support the creation of the required observe files; see the
the Observe File Preparation section below for more information.
Note that EVLA observations in IFs A/C below the traditional
lower VLA frequency limit suffer from saturation issues caused by too
large a frequency shift in the signal path. IFs B/D will give useful
data since their lack of automatic attenuation prevents the saturation
seen in IFs A/C. We see this behavior in L-band below 1250 MHz and in
C-band below 4400 MHz.
Maximum IF separation
Whereas for the old VLA LO system the maximum IF separation is 500
MHz (between extreme band edges), for the EVLA this goes up
dramatically.
Currently the maximum IF difference for EVLA antennas is 4 GHz,
obviously subject to the restrictions of the receiver bandwidth. This
is still an area of development, however, and we recommend observers
to monitor this section for the latest news. This new IF separation
has been demonstrated to work for C-band; for now, we recommend
observers planning K-band and higher to contact us prior to observing.
Eventually, for the higher frequencies, the maximum difference
between IFs is expected to go up to 12 GHz; we will announce this as
soon as this is the case.
L-band
Test observations below 1200 MHz have recently been carried out
with the EVLA to assess the feasibility of pursuing spectral-line
observations for red-shifted HI 21cm or other spectral-line
transitions at frequencies where the VLA has severe limitations and/or
simply cannot observe.
These test observations show that successful observations are
possible with the EVLA at frequencies that are believed to be
dominated by RFI due to aeronautical navigation transponders, at least
in A and B configurations. As this RFI is more evident on the shorter
spacings, as well as at day-time hours, more tests will be carried out
at various hours of the day and in C and D configurations to fully
assess the limitations on astronomical observing due to these
transmissions. We expect that daytime observations at these
frequencies may be much more difficult.
Note that, for reasons explained above, below 1250 MHz only B/D
data are usable.
This new 1.0-1.2 GHz capability on the EVLA is now available for
users, and NRAO will consider exploratory proposals to use it in the
current configuration through the end of D configuration, 15 September
2008. Click here for more
information.
C-band
Most EVLA antennas currently in the array (see the table in the relevant section for the current
status) have the new wide-band C-band receivers installed, which can
be tuned outside the traditional VLA C-band range (4.5 - 5.0 GHz).
Tests show that meaningful results can now be obtained from 4.2 - 4.5
GHz and from 5.0 - 7.7 GHz as well. The rms (in arbitrary units) as a
function of frequency between 5.5 and 8.0 GHz is plotted here. The features at 6.0, 6.4, and 7.9 GHz
are resonances which we expect to go away once the Ortho Mode
Transducers (OMTs) are installed some time in 2008.
A plot showing the K value against frequency is shown here at higher frequency resolution than
the figure referred to above. This plot covers in detail the range
from 5900 to 6700 MHz. This range was chosen since it is not only
there that the resonances occur, but it also contains the familiar OH
lines at 6031 and 6035 MHz and the Methanol line at 6668 MHz. See the
Observational Status Summary for a definition of the K-value.
Note that at outside the traditional C-band range polarization
information is lost, as illustrated by this
figure showing the ratio RL/RR for two baselines for an
unpolarized source. Note that only between 4.5 and 5.0 GHz this ratio
is close to zero, as expected for an unpolarized source. Polarization
observations won't be able to exploit the extended frequency range
until the installation of the OMTs.
To illustrate the opportunities this new frequency range offers, we
observed a number of maser lines in W3OH. In figures 1 - 3 we show
their scalar cross-power spectra on one of the EVLA - EVLA baselines.
Figure 1 shows the 6030.747 MHz OH line, figure 2 the 6035.092 MHz OH line, and figure 3 the 6668.5192 MHz Methanol line. The
flux density scale is indicated below the plot; because of a lack of
accurate calibrator flux densities at these frequencies we did not
perform any flux calibration; we expect true flux densities to be
about 40% higher than the y-axes indicate.
Test observations at frequencies between 3800 and 8200 MHz show that
the sensitivity of IF pair AC degrades significantly at frequencies
below 4400 MHz. During the transition period, observers interested in
using the EVLA with the current VLA correlator to observe at C-band
frequencies between 3800 MHz and 4400 MHz need to utilize IF pair BD.
If all four IFs are needed, the automated power adjustment for IF pair
AC needs to be disabled in the observing script. For the latter,
contact local staff. Please direct technical questions about
observing at these frequencies to Emmanuel Momjian.
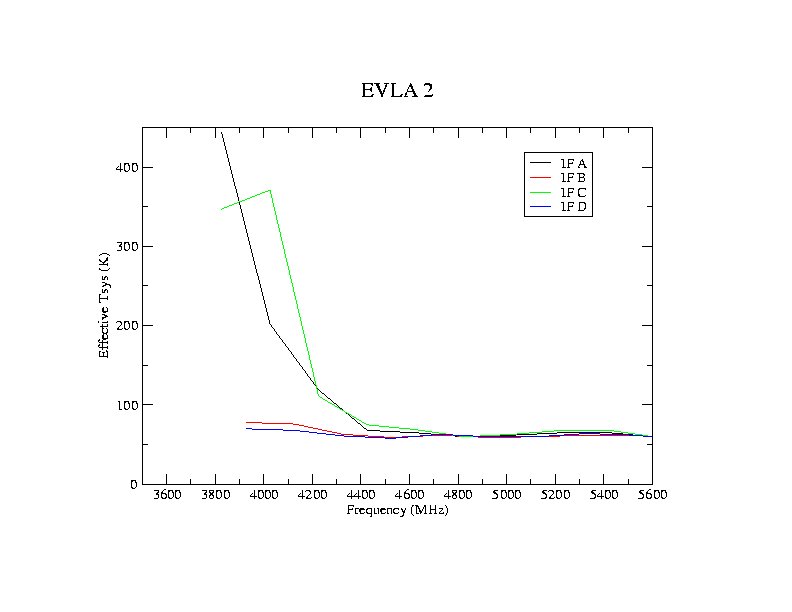 Figure 1: Effective system temperatures for all four IFs of
EVLA antenna 2 between 3800 and 5600 MHz
Figure 1: Effective system temperatures for all four IFs of
EVLA antenna 2 between 3800 and 5600 MHz
K-band
Most EVLA antennas currently in the array (see the table in the relevant section for the current
status) have the new wide-band K-band receivers installed, which can
be tuned outside the traditional VLA K-band range (21.2 - 25.2 GHz).
Recent tests show that meaningful results can be obtained from 18.1 -
26.5 GHz, with a small penalty in performance at the extreme ends, as
shown in this figure, which plots the
rms (in arbitrary units) averaged over the four IFs as a function of
frequency at the band edges. Note that at 18.1 and 18.3 GHz not all
IFs led to a solution. Between these edges, the rms rises linearly
with frequency, with a slope largely determined by the frequency
dependent antenna efficiency.
Observe file preparation specifics
Since observations at the new L, C, and K-band frequencies can only
be done with EVLA antennas, there is no danger of introducing phase
jumps caused by the small fluke changes while Doppler tracking, on VLA
- EVLA baselines. After a temporary 'ban' on all Doppler tracking we
now can recommend Doppler tracking again for EVLA - EVLA only
observations (see here for
further details).
If you don't want Doppler tracking, you will need to specify the
appropriate VLA LO settings directly in the observe file. Note that
these are 'illegal' LO settings as far as the VLA is concerned, and
JObserve will not accept them - they are only used to set the
appropriate values in the EVLA LO chain. In the specific case of
L-band observing between 1000 and 1200 MHz we have made an online
version of the LOSER program available.
For general help on finding LO values in order to arrive at the sky
frequency of your choice, please contact Gustaaf van Moorsel
|
